
By Jørn Otto Hansen
GEAR makes high-end bicycles in the United States, and every bike is built to order. Customers choose the frame, wheels, gears, brakes, saddle and paint themselves. That’s what the brand is known for, and it’s also where its problems start.
GEAR isn’t a real company. It’s the case for the 48-hour take-home exam in Data Driven Management Accounting at BI, where we got GEAR’s data and three problems to solve in Python. Each problem turned out to hide something the company didn’t know about itself.
GEAR measures itself with a balanced scorecard. It’s a set of targets seen from four angles: money, customers, how well the work gets done, and whether the company is learning and improving. Each market has 14 measures, each with a target.
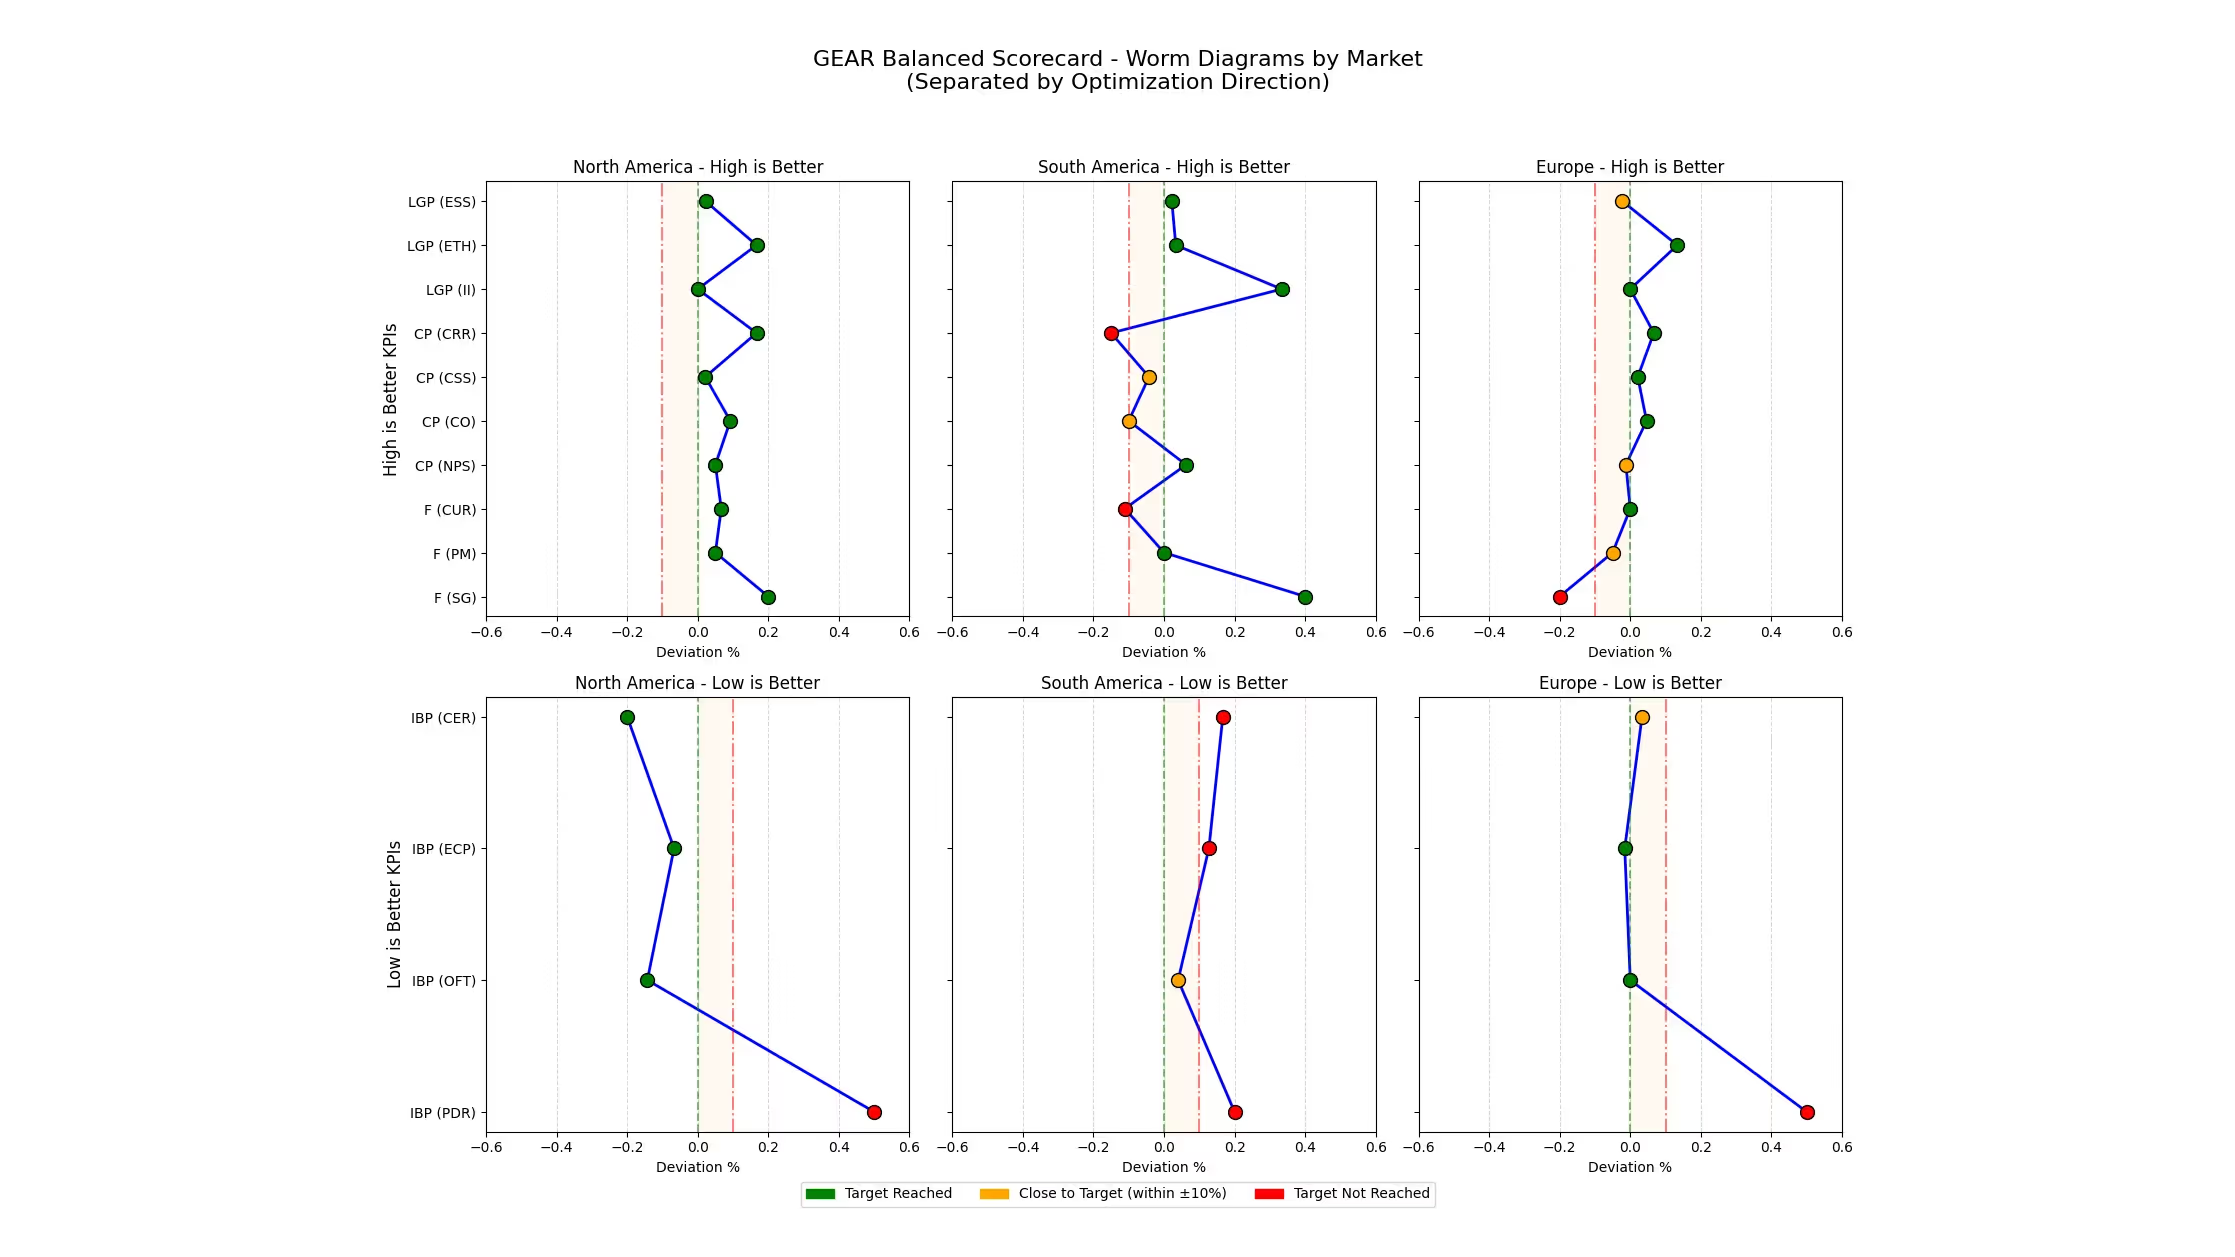
The first task was to turn that into an interactive dashboard where you pick a market and every measure lights up green (target met), orange (missed by up to 10%) or red (missed by more). Then GEAR wanted an overview of all three markets at once, so I drew a “worm diagram” for each one. That’s the picture at the top of this article.
A worm diagram shows every measure as a dot and links them with a line, so a healthy market is a calm worm on the green side, and a struggling one wriggles into the red. I split each market in two, because for some measures higher is better (sales, satisfaction) and for others lower is better (faults, delivery time). Mixing them in one picture would have been confusing. In the top row, dots to the right of the green line beat their target. In the bottom row, it’s the dots to the left. The labels are short for the four angles: learning and growth (LGP), customers (CP), money (F) and how well the work gets done (IBP).
North America hits 13 of its 14 targets. South America misses more than half. It’s losing customers (51% stay, against a target of 60%), earns less on customisation than planned, and pays more for each custom build.
But one target is missed in every market: the defect rate. Three percent of bikes come out faulty in North America and Europe, against a target of two, and six percent in South America, against five. When the same measure is red everywhere, it’s rarely about one market. It’s about the product, and that led straight to the next problem.
GEAR also wanted to use the same scorecard when it moves into Asia and Australia. My advice was to keep the same measures, so the markets can be compared, but set the targets locally. Customers, costs and delivery times differ too much for small tweaks to be fair.
The production manager suspected that all the customisation was causing the faults. With 13 choices on every bike, from the frame to the pedals, the combinations run into the millions, so nobody could see which ones were the problem. He had three options:
To choose, you first need to know what a fault costs. A happy customer is worth about $10,000 to GEAR over the years. If they get a faulty bike, that drops by 60%, and returns and warranty work cost another $2,000 on average. So a faulty bike that slips through costs $8,000. Checking a bike costs $500, and fixing a fault you catch costs $400.
That gives four outcomes for every bike, depending on whether it’s actually faulty and whether we check it. This is what each one is worth to GEAR:
With 10,000 past orders, I trained a decision tree. It’s a chain of yes-or-no questions about a bike (“Does it have multiple gears? Steel wheels?”) that ends in a guess: faulty or fine. Most models are judged on how often they guess right. I judged this one in dollars, using the costs above, so it would learn what matters to GEAR: catching an $8,000 mistake is worth far more than wasting a $500 check.
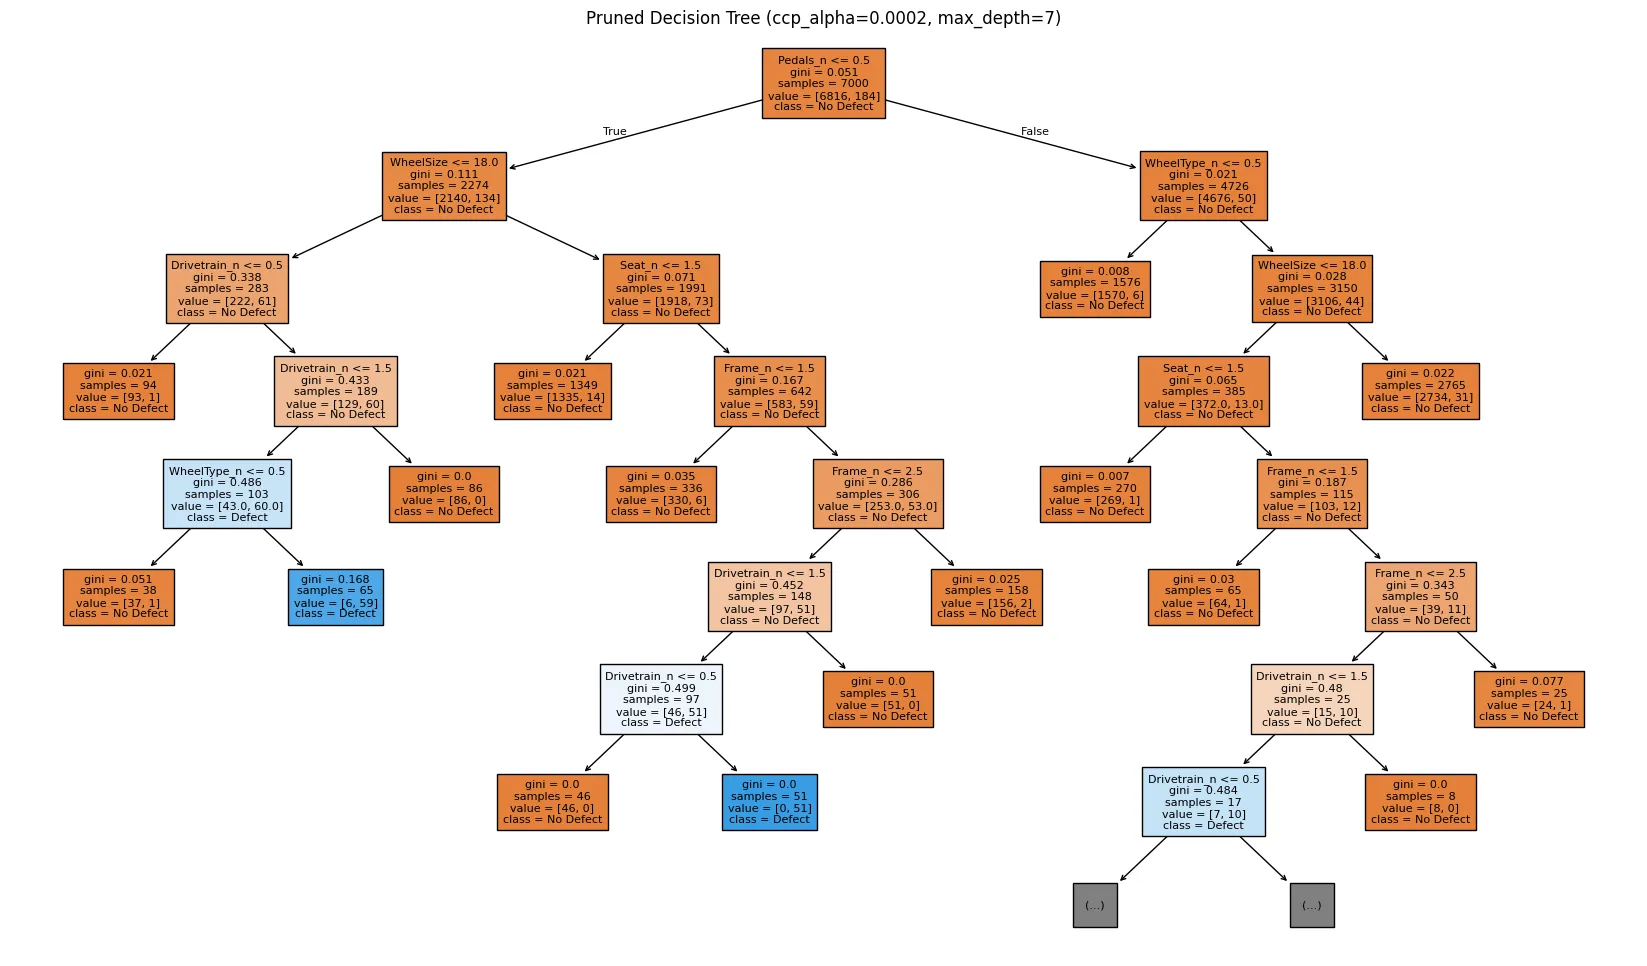
The tree from my exam, trimmed to seven levels. Each box asks one question about the bike, and the blue boxes are where it expects a fault. The parts are stored as numbers, so “Drivetrain_n <= 0.5” means “is it one particular type of drivetrain?”. Click to enlarge.
The tree found that one part of the bike explains more than half of the faults, the drivetrain, the system of gears and chain that drives the wheels:
Share of bikes with a fault, by drivetrain
Bikes with multiple gears are about seven times more likely to be faulty than the rest. After that come steel wheels and steel frames. So the problem isn’t customisation in general. It’s a few specific parts.
And here’s what each option earns per bike:
Profit per bike for each option, in dollars
Checking the bikes the tree flags as risky earns the most, about $9,909 per bike. For the random inspections, I simulated picking 1,000 bikes a thousand times over, to see how much luck matters:
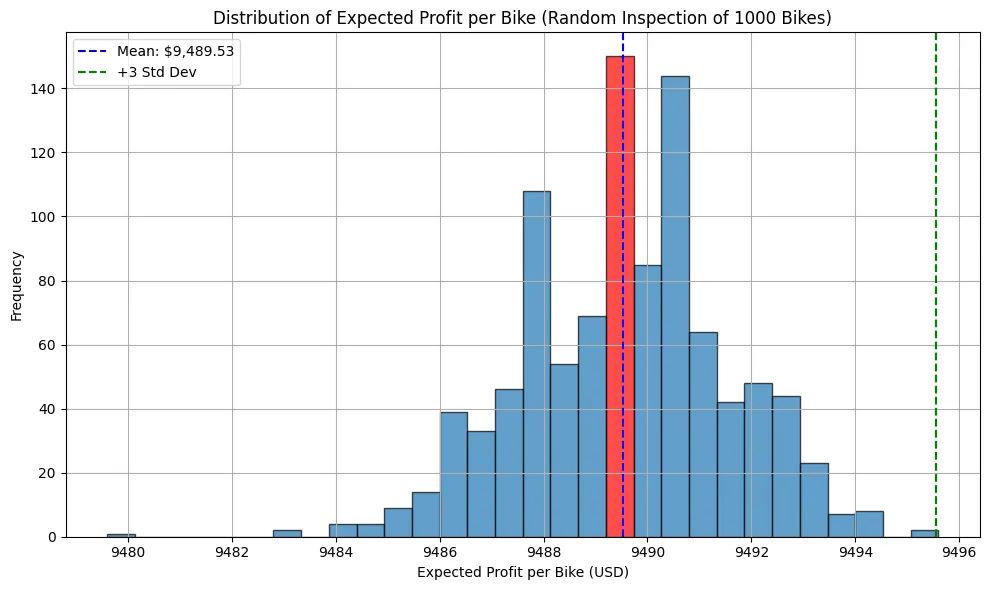
A thousand simulated random inspections from my exam. Even the luckiest one, far out on the right, stays below $9,500 per bike, well short of the $9,909 from the decision tree.
The surprise is at the bottom of the chart above. Inspecting 1,000 random bikes earns less than doing nothing at all. Only about 3 in 100 bikes are faulty, so most of those $500 checks find nothing. Random checks feel responsible, but here they cost more than they save. Doing nothing is easy to work out, because 2.6% of bikes are faulty:
The last problem was about security. GEAR gave us its login log, every attempt to log in to the company’s computers from May to November 2022. That’s almost 1.3 million attempts.
Staff have to log in again after every break, so lots of logins are normal, about four and a half per person per day. The weekly pattern looks just like a normal working week:
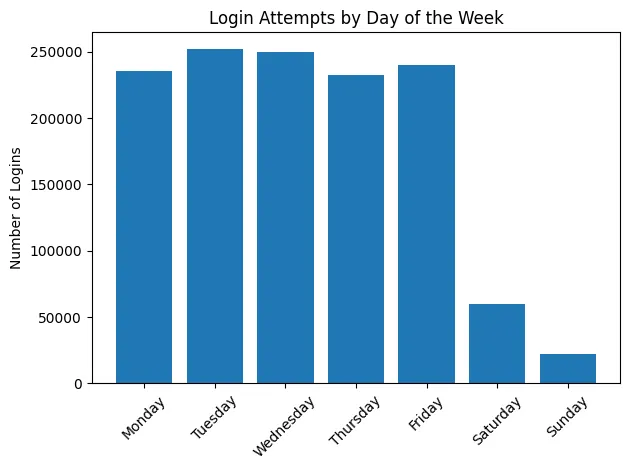
Login attempts by day of the week, from my exam.
But one attempt in five failed, which is a lot. And when I matched the log against the employee list, two things stood out.
People who had left were still getting in. Five former employees tried to log in 4,595 times after their last day, and 3,413 of those attempts worked. Four of them had left in the autumn of 2022. The fifth left in September 2013, and nine years later that account was still being used almost every working day:
Logins after the person had left the company
Here’s the one who left in 2013, day by day:
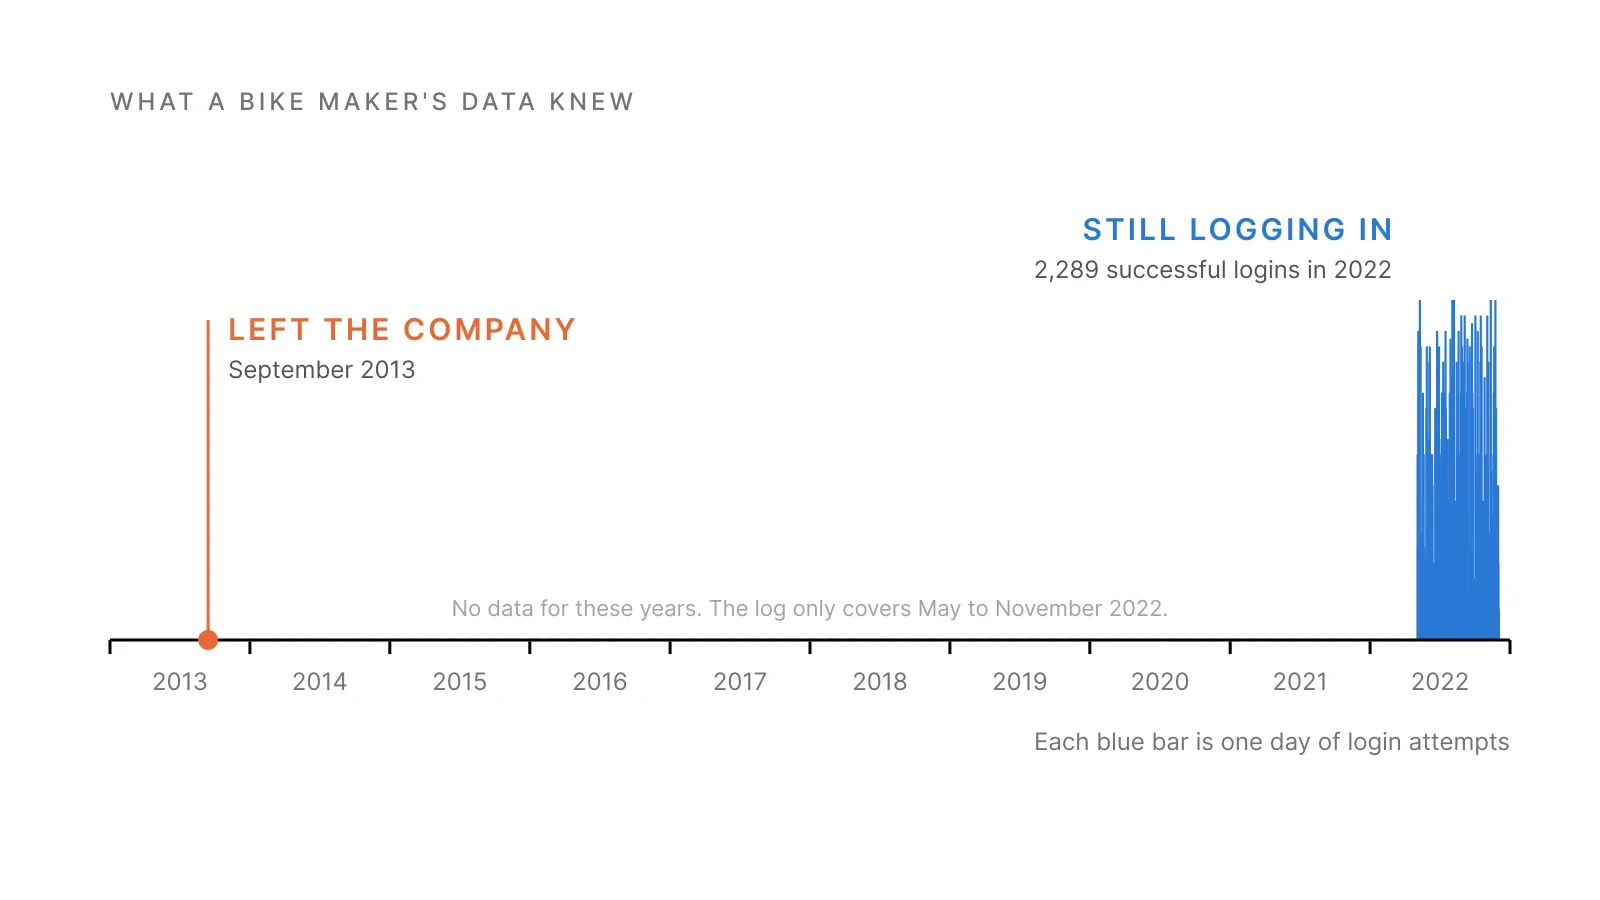
Each blue bar is one day of login attempts on the account. The log only covers May to November 2022, so the years in between are blank because there’s no data, not because nobody logged in.
The accounts were simply never switched off. My recommendation was to lock an account automatically on the employee’s last day, and to raise an alert whenever someone who has left tries to log in.
Someone was trying the front door. There were 1,277 attempts to log in as “Admin”, a username that doesn’t belong to anyone at GEAR. Every one of them failed. They came from all over the world:
Attempts to log in as "Admin", by country
Trying common usernames like “Admin” over and over is a classic sign of someone guessing their way in. Here it didn’t work, but it’s worth blocking and watching those addresses.
This is based on my 48-hour take-home exam in Data Driven Management Accounting (EBA3630) at BI Norwegian Business School, May 2025. GEAR and all its data are a made-up case from the course, and I’ve left out the names of the employees in it. I solved the exam in Python, and you can read the full exam, with the code, using the button next to this article.
For this article I also worked out two things the exam didn’t ask for: the profit of doing nothing, and how many of the logins after people had left actually worked.
[SYS.03 // ADVISORY.OPEN]
I take on the occasional advisory job, custom software architecture and research collaboration. There's no sales funnel. You write to me and I answer.
NP // NORDICPRODUCTIONS.NO