
By Jørn Otto Hansen
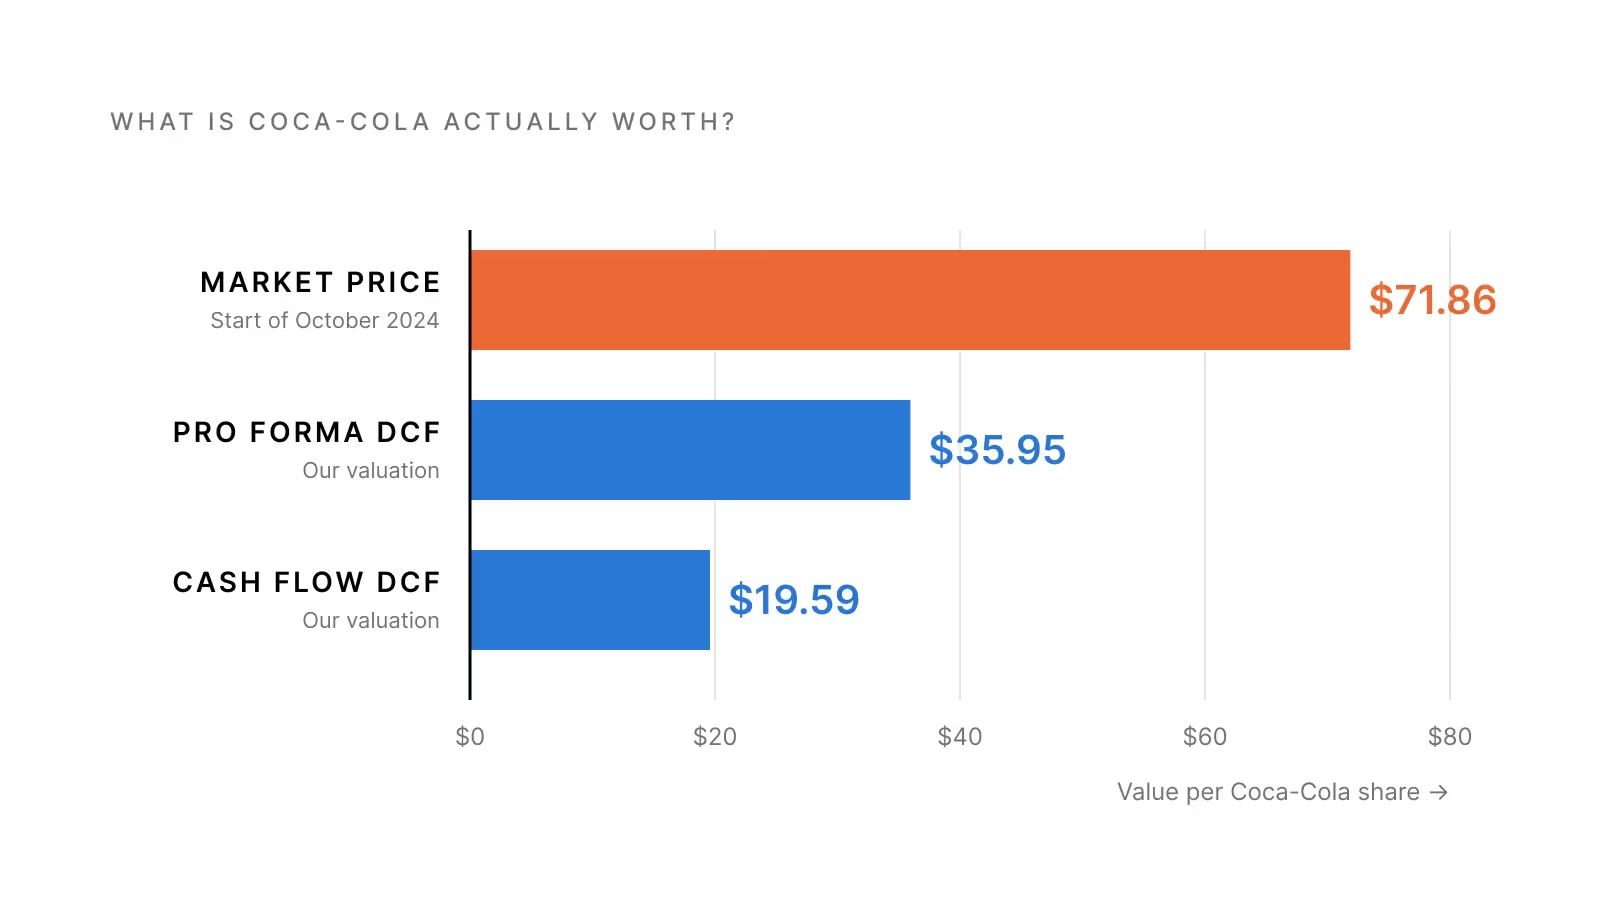
Financial Modelling in Practice at BI is a course about one thing: building financial models in Excel that actually work. In autumn 2025, three of us worked through the group project together. It had six parts, each teaching a new tool, and the last two put all of them to use on one real company: Coca-Cola.
Every part was handed in twice, as an Excel workbook with all the calculations and as a PDF with our answers. The real work lives in the spreadsheets, so that’s mostly what you’ll see here.
The first task was a savings plan for an imaginary 23-year-old client. He wants to retire at 70, take out $110,000 a year from then on (rising with inflation), and still have $600,000 left when he turns 97. Along the way life happens: a boat at 28, a wedding at 30, a deposit on a house at 33, college for two children, a recession every ninth year that wipes out 9% of his savings, and a boom every seventh year that adds 5%.
The question was simple: how much does he need to put in at 23, if every later deposit grows with his salary? We built every year of his life as a row, and let Excel’s Goal Seek find the answer: $35,605.72.
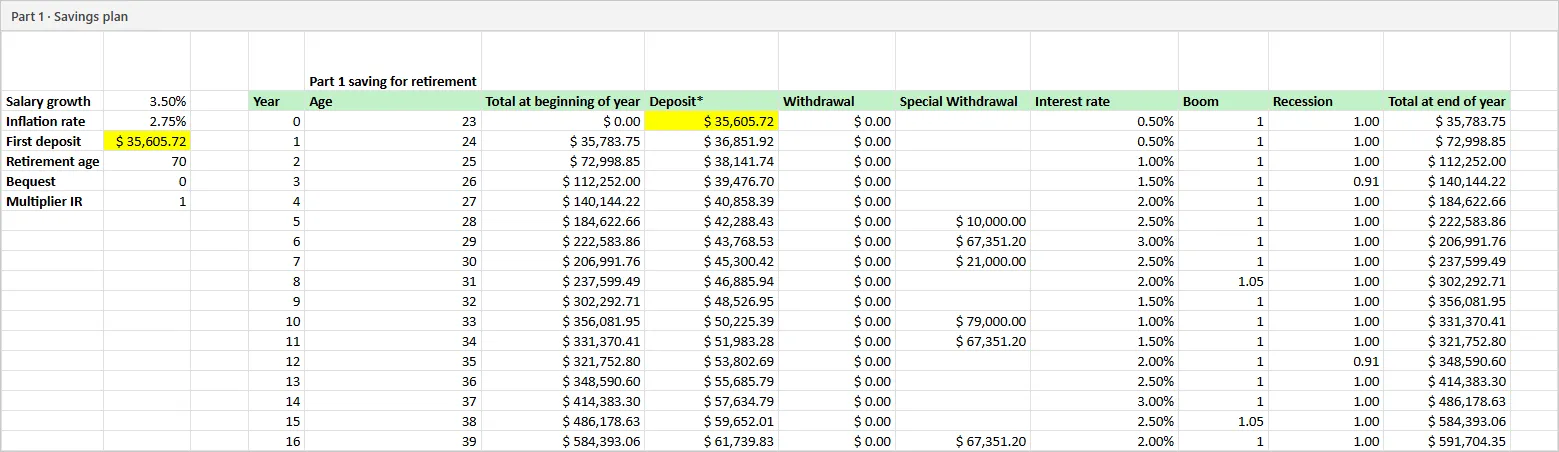
The first years of the savings plan. The yellow cell is the answer Goal Seek found. The plan runs all the way to age 97 further down.
Then we tested it. Which inputs change the answer the most? Not the boat, the wedding or even a third child (that only lifts the deposit to $37,988). By far the biggest lever was the return on his savings. That idea came back later, and it’s also the heart of my article You are a cash flow.
Next came portfolios. If you can spread your money across several stocks, which mix gives the most return for the risk you take? The answer is a curve called the efficient frontier. Every point on it is the best you can do for a given level of risk, and every single stock sits somewhere below it.
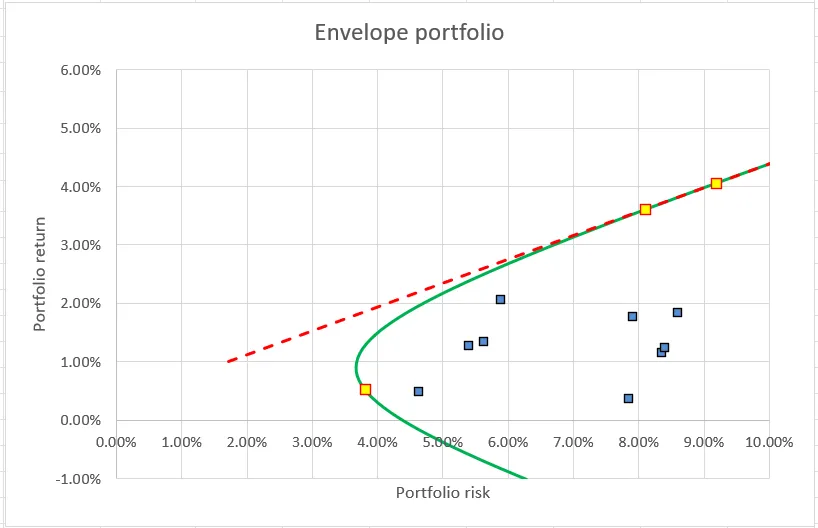
From our Part 2 workbook. The green curve is the efficient frontier, and the blue squares are the individual stocks. Each one is worse on its own than a mix on the curve.
One lesson stuck with me: when you add a stock to a portfolio, how it moves together with the rest matters more than how wild it is on its own. A risky stock that zigs when the others zag can make the whole portfolio calmer.
In Part 3 we used the Black-Litterman method, a way to add your own opinions (“I think this stock will beat that one”) to a portfolio without the maths going to extremes. Compared with portfolios built only on past returns, it gives far more modest and stable results:
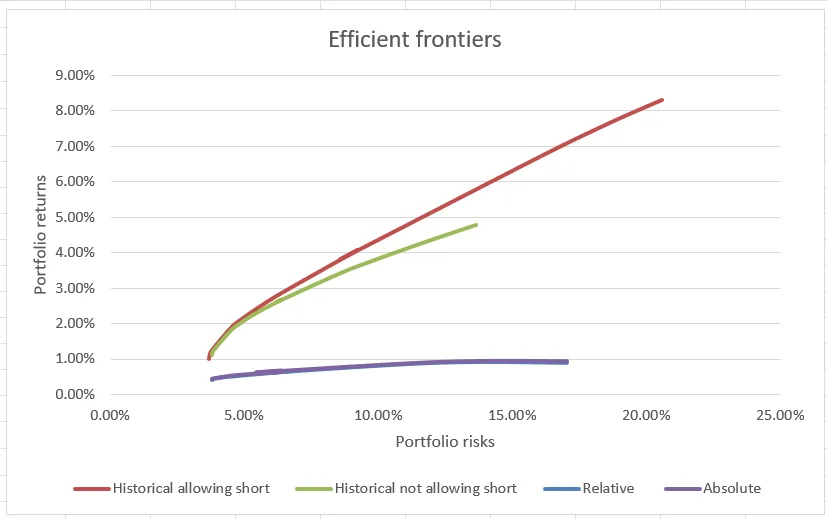
Our Part 3 frontiers. The red and green curves trust past returns. The flat purple and blue curves are the Black-Litterman versions, which stay close to what the market as a whole expects.
Part 4 was all VBA, the programming language inside Excel. We wrote our own worksheet functions, like myNPV, which works out what a series of future cash flows is worth today and can switch between yearly and continuous compounding. Checking it against Excel’s own NPV function gave exactly the same answer, 116.14:
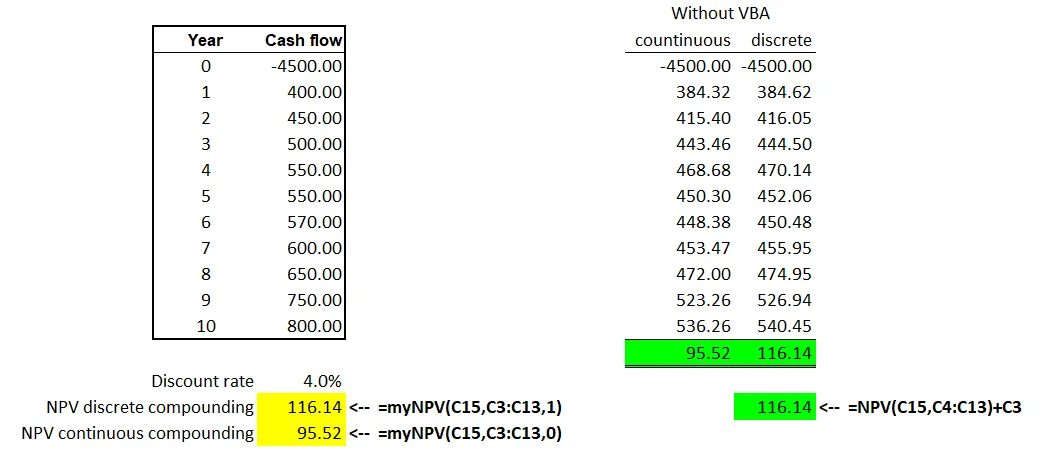
Our own myNPV function (yellow) against Excel’s built-in NPV (green).
Behind every function is code like this, which builds the table of how a group of stocks move together:
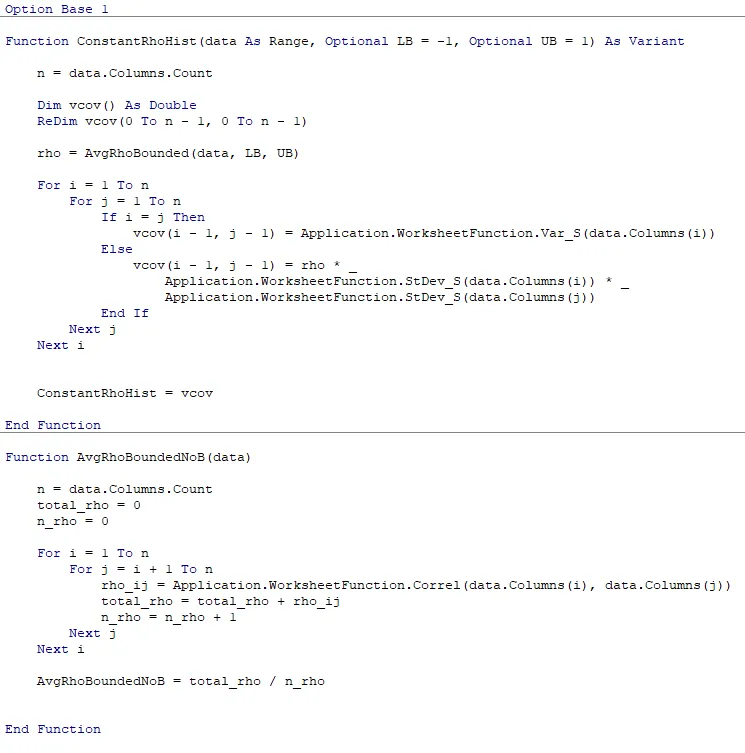
A piece of our VBA. It took hours of debugging, but we ended up using these functions all the way through the Coca-Cola valuation.
The last two parts brought it all together. The task: value Coca-Cola from its own accounts, and tell a client whether the share price makes sense.
To value a company, you discount its future cash flows by the return investors demand for the risk. For a company with both shareholders and lenders, that’s the weighted average cost of capital, or WACC:
and are the values of the shares and the debt, and what shareholders and lenders expect, and the tax rate.
The hard part is , because nobody tells you what shareholders expect. So we estimated it five different ways, and combined them with two different costs of debt. That gave ten estimates for the same company, ranging from 5.06% to 9.28%:
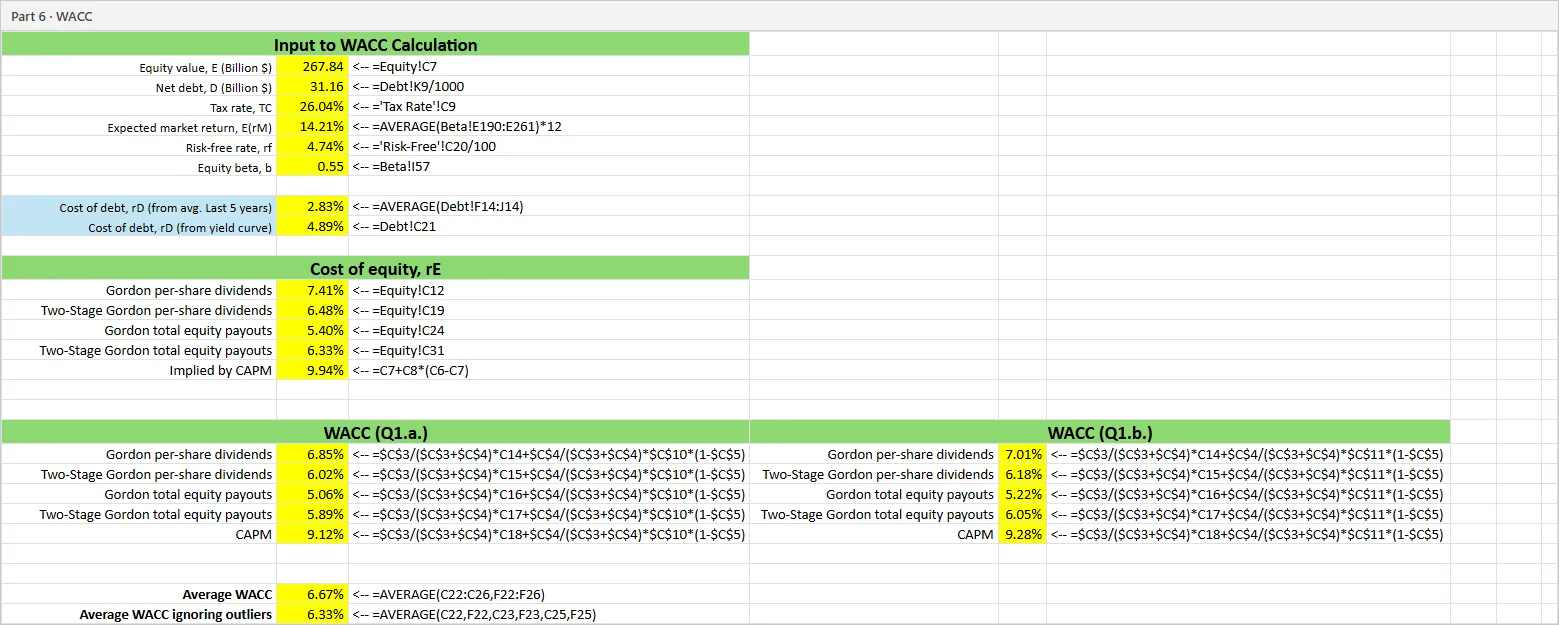
Our WACC sheet. The yellow cells are the results, and the text beside each one shows the formula behind it, so anyone can check the work.
The highest estimates came from CAPM, the classic textbook model. Coca-Cola’s beta is only 0.55, meaning its share moves about half as much as the market. But the expected market return in our data was a very high 14.21%, and that pushed CAPM’s answer up. The lowest came from a method based on share buybacks, which reflects management’s choices more than the company’s risk. We left out both extremes and landed on a WACC of 6.33%.
Next, we forecast Coca-Cola’s free cash flow, the cash left over after running and investing in the business, and valued it in two different ways.
The first way starts from the cash flow statement (CSCF). Coca-Cola’s free cash flow fell sharply in 2024, to $4.35 billion, which made the recent trend look like a 15% drop every year. That felt too gloomy for a company like Coca-Cola, so we assumed 4% growth for the next five years and 2% after that. The value of everything after 2029 is captured in one number, the terminal value:
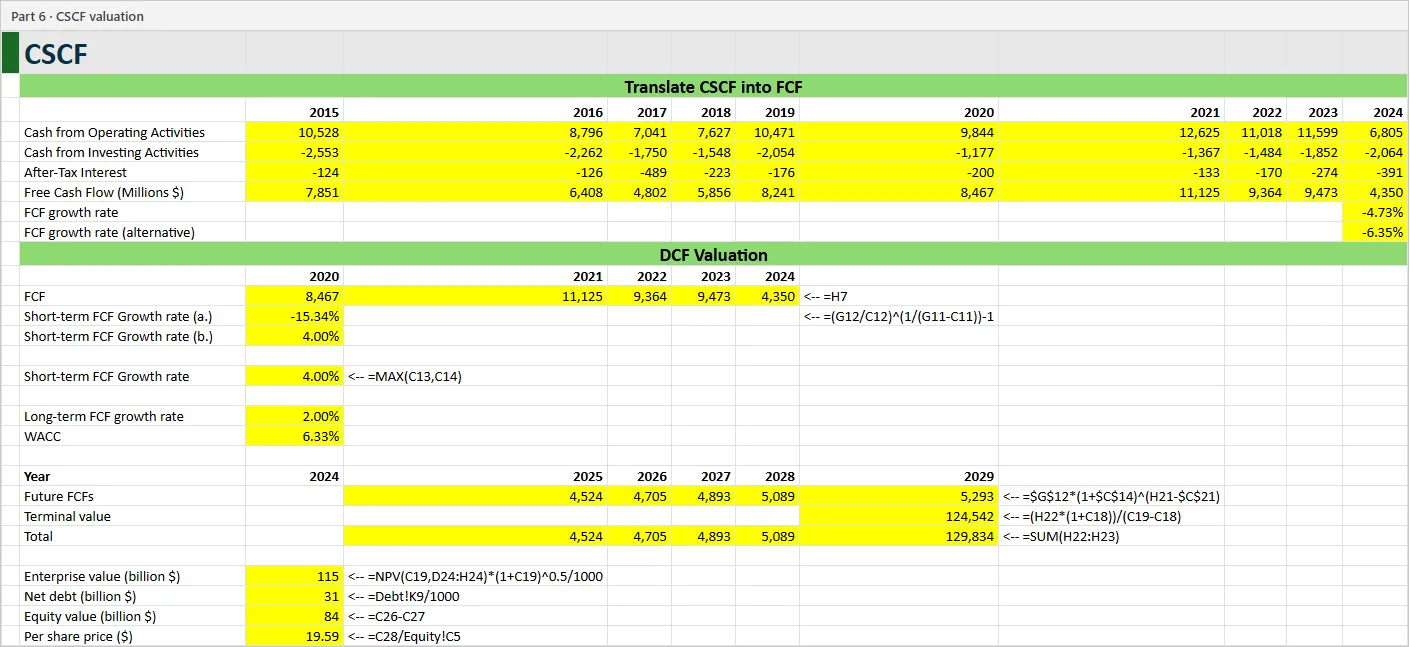
The cash flow valuation. From ten years of Coca-Cola’s own numbers down to a value of $19.59 per share at the bottom.
The second way, the pro forma model, builds complete forecast accounts for Coca-Cola, with an income statement and balance sheet for every year to 2029. Each line follows a ratio we chose from the history, like costs as a share of sales:
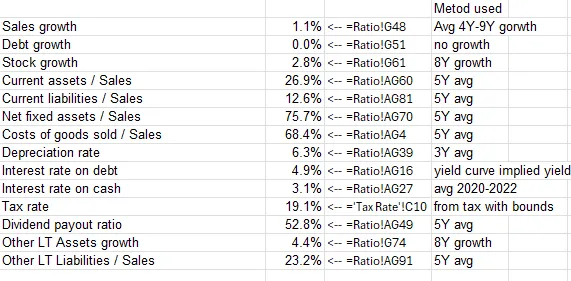
Our assumptions for the pro forma model, and how we chose each one.
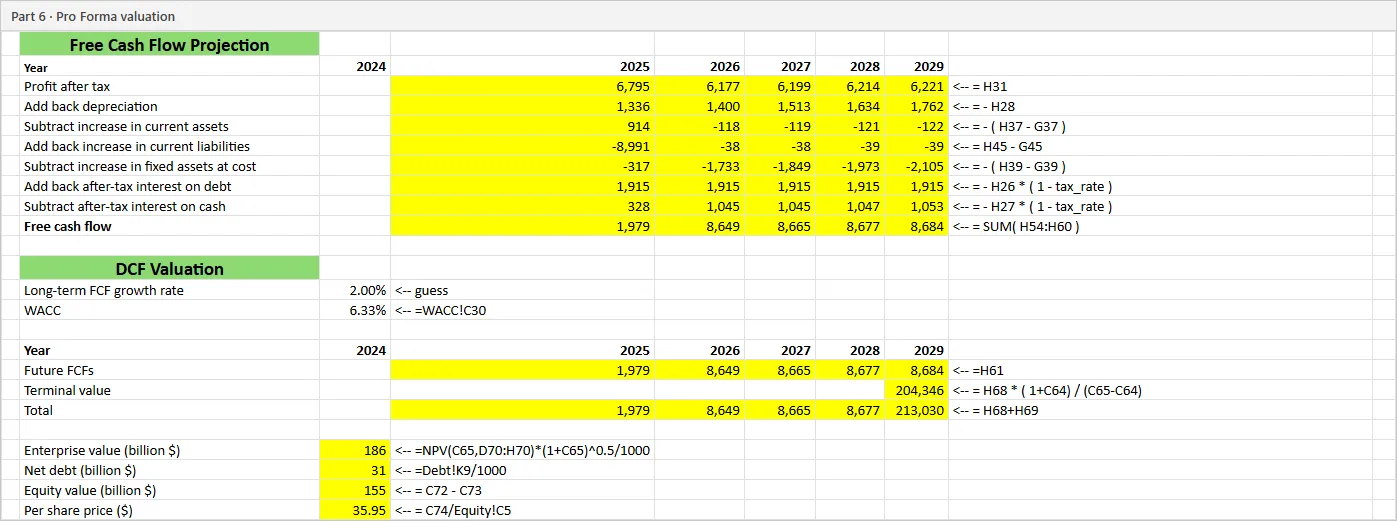
The pro forma valuation, ending in a value of $35.95 per share.
At the start of October 2024, a Coca-Cola share cost $71.86. That’s twice our higher estimate and more than three times the lower one.
So what would you have to believe to pay $71.86? A sensitivity table answers that by running the valuation again for many combinations of long-term growth and WACC:
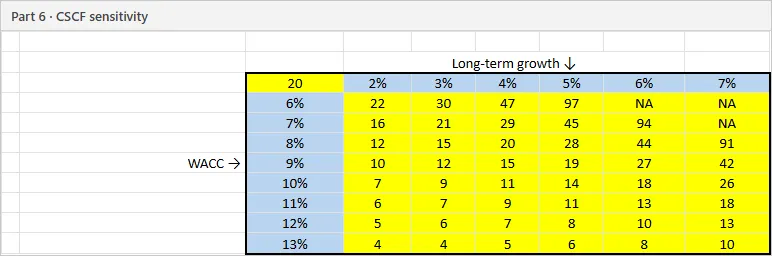
Share price in dollars from the cash flow model, for different long-term growth rates (across) and WACCs (down).
To get close to the market price, both models need Coca-Cola’s cash flow to grow by about 7% a year forever, with a WACC of 8 to 9%. For a mature company that already sells drinks in almost every country on earth, that’s a big ask.
Our advice to the client was to hold or sell. On the numbers, the share looks expensive. But Coca-Cola pays a steady, growing dividend, is far calmer than the market and has one of the strongest brands in the world. Investors seem willing to pay a lot for that safety, more than a cash flow model can capture. Of the two models, we trusted the pro forma one most, because the cash flow version is thrown off by a single weak year like 2024.

Thanks to Nicholas Chong (left) and Jibbe van der Schenk (right). Together we managed to get an A in the course.
This is based on our group project in Financial Modelling in Practice (FIN3616) at BI Norwegian Business School, autumn 2025. We were a group of three, Nicholas, Jibbe and me, and every calculation was done in Excel, with VBA for our own functions. The spreadsheet images here are drawn from the workbooks we handed in.
[SYS.03 // ADVISORY.OPEN]
I take on the occasional advisory job, custom software architecture and research collaboration. There's no sales funnel. You write to me and I answer.
NP // NORDICPRODUCTIONS.NO